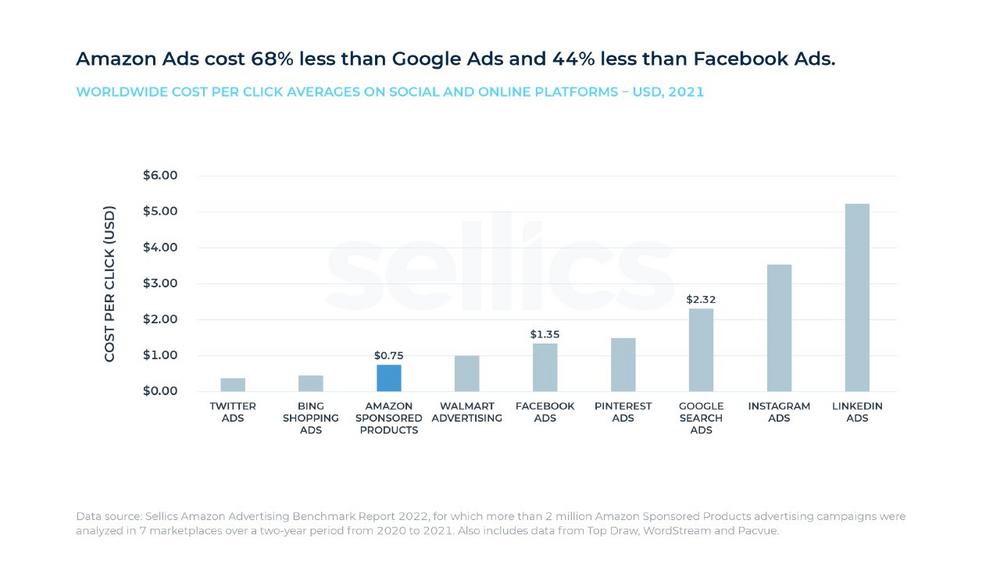
Amazon Ads Cost 68 Percent Less Than Google Ads and 44 Percent Less Than Facebook Ads, Sellics Study Reveals
The study was conducted by experts at Sellics, a leading provider of Amazon Advertising software and market intelligence. Sellics looked at Amazon Sponsored Products, the main advertising format on Amazon, with ads appearing in search results and on product pages.
Amazon is uniquely attractive for B2C and retail advertisers
Google and Facebook are the two largest players in the digital advertising space. Amazon, as the third-largest competitor, has caught up significantly in recent years. At the same time, global advertising costs on Amazon (cost per click of $0.75 globally, $0.87 in US), are still lower than on many other platforms. Amazon compares favorably in terms of global costs not only with Google (-68 percent) and Facebook (-44 percent), but also other major players like Instagram (-79 percent) and LinkedIn (-86 percent), as well as close competitor Walmart (-25 percent internationally or -13 percent compared with Amazon US).*).
However, “It’s not just the lower cost per click that makes Amazon stand out for advertisers. Amazon is unique as an advertising platform as it combines a high purchase intent retail platform that generates revenue cost-efficiently with an enormous reach and traffic. Don’t forget that Amazon is the top starting point for product searches across the whole web, which makes it extremely attractive for B2C and retail advertisers," said Thomas Ropel, an advertising veteran and CMO at Sellics.
In 2021 Amazon.com’s seller ad revenue stabilized well above the pre-pandemic level and its ad space became more competitive
The pandemic made 2020 a boom year for Amazon.com (and e-commerce in general). In 2021, sellers’ revenues from Amazon Advertising campaigns grew by 23 percent.
This represents a surge in ad revenue above the already-high 2020 baseline and reveals that ad revenue is stabilizing well above pre-pandemic levels. It’s also a strong indicator that Amazon remains a highly attractive platform for advertisers, despite growing competition driving a 22 percent increase in cost per click in 2021.
Canada and Germany present opportunities for US sellers
In 2021, Amazon.com (US) was by far the largest but also the most competitive Amazon marketplace, with the highest cost per click ($0.87) and lowest return on ad spend ($2.81) compared to other large Amazon marketplaces.
The Canadian Amazon marketplace represents an opportunity for US sellers with a slightly higher return on ad spend (+15 percent). US sellers should, however, prepare for a somewhat different environment with lower conversion rates (-39 percent) and lower cost per click (-41 percent).
For sellers weighing up options for entering European marketplaces, the UK has a very similar environment to the US and a low language barrier. Germany is an attractive opportunity as the second-largest Amazon marketplace globally in 2021, with a high return on ad spend (39 percent higher than the US), due to its relatively low cost per click (46 percent less than the US) and strong conversion rates (only 20 percent less than the US).
Product categories Tools, Sports, and Scientific have the highest Return on Ad Spend
Diving even deeper into the US Amazon marketplace, Sellics analyzed the main advertising performance metrics (click-through rates, conversion rates, cost per click, average order value, return on ad spend, and advertising cost of sale), in addition to opportunities across all main product categories on Amazon.com.
The overall best and worst categories in terms of return on ad spend (ROAS) and advertising cost of sale (ACOS) were:
- Best categories: “Tools & Home Improvement” (ROAS $4.04, ACOS 24.8%), “Industrial & Scientific” (ROAS $3.47, ACOS 28.8%), and “Sports & Outdoors (ROAS $3.31, ACOS 30.2%)
- Worst categories: “Beauty & Personal Care” (ROAS $2.27, ACOS 44.1%), “Baby Products” (ROAS $2.37, ACOS 42.1%), and “Health & Household” (ROAS $2.55, ACOS 39.3%)
One of the key takeaways is that there are large differences between product categories on Amazon, not only for overall ad efficiency but also for its determining factors like click-through rates, conversion rates, cost per click, and more.
Brands need to understand what is happening in their specific categories so that they can see where to optimize. “If you’re selling cameras at $125 a unit, a conversion rate of 5 percent will put you well ahead of the other sellers in your space. But if you’re selling HDMI cables at $10, you’ll need a lot of shoppers to convert or else you’ll really struggle to turn a profit,” said Thomas Ropel from Sellics.
Sellics offers a free tool—the Sellics Benchmarker—that brands can use to get average values for all the advertising performance metrics in their specific category, subcategory, and marketplace.
Sellics‘ 2022 eCommerce Advertising Benchmark Report can be downloaded for free here:
https://sellics.com/amazon-advertising-benchmark-report-2022/?utm_campaign=benchmark-report&utm_medium=referral&utm_source=pr&utm_content=EN_Benchmark_Report_2022_PR
About the Report
Sellics‘ 2022 eCommerce Advertising Benchmark Report contains extensive data, insights, and recommendations for marketers, sellers, brands, and agencies.
The findings are drawn from a broad study of anonymized data from over two million Amazon ad campaigns on Amazon (“Amazon Sponsored Products”) by advertisers on Amazon (sellers and vendors), spanning seven marketplaces and a wide range of product categories throughout 2020 and 2021.
Values given for metrics are averages (medians) for ratio metrics (e.g. cost per click, return on ad spend). For ad spend and ad revenue, growth rates or indexed values are given based on advertisers who have been active throughout the entire referenced period.
If not otherwise stated, values have been calculated by Sellics. The trends and figures in the report do not represent or indicate the official performance of Amazon and Amazon Advertising, nor do they necessarily reflect the experiences of every advertiser on Amazon.
* The cost per click values for Amazon have been calculated by Sellics. The international value represents the weighted average of Amazon’s largest North American and European marketplaces (US, Germany, UK, France, Italy, Spain, and Canada). Weightings are based on Amazon’s net sales in each location in 2021. For the comparison with cost per click on other platforms, Sellics has drawn on international averages taken from third-party studies. All information on sources can be found in the complete report.
Sellics is a leading provider of advertising optimization software and market intelligence whose mission is to make Amazon Advertising easier and less time-consuming for their users while improving their performance and growing their business. Sellics achieves this by pairing an innovative software platform for advertising optimization and automation with market-leading actionable insights and competitive intelligence.
Sellics Marketplace Analytics GmbH
Str. der Pariser Kommune 18d
10243 Berlin
Telefon: +49 (30) 55570-100
http://sellics.com/de
PR Consultant
Telefon: +49 (69) 970705-32
E-Mail: jens.esser@psmw.de
![]()